Projects
In the summer of 2020 I took a GIS course based in R. This was my first experience coding and learning about data science and it made me realize how important these skills can be in any field. Here is a collection of links!
Building a project website
In this project I:
- Learned the basics of RStudio
- Was introduced to Rmarkdown, YMAL, CSS, and HTML
- Created code to construct and personalize a website
- Familiarized myself with Github and learned why is important for version control and publishing
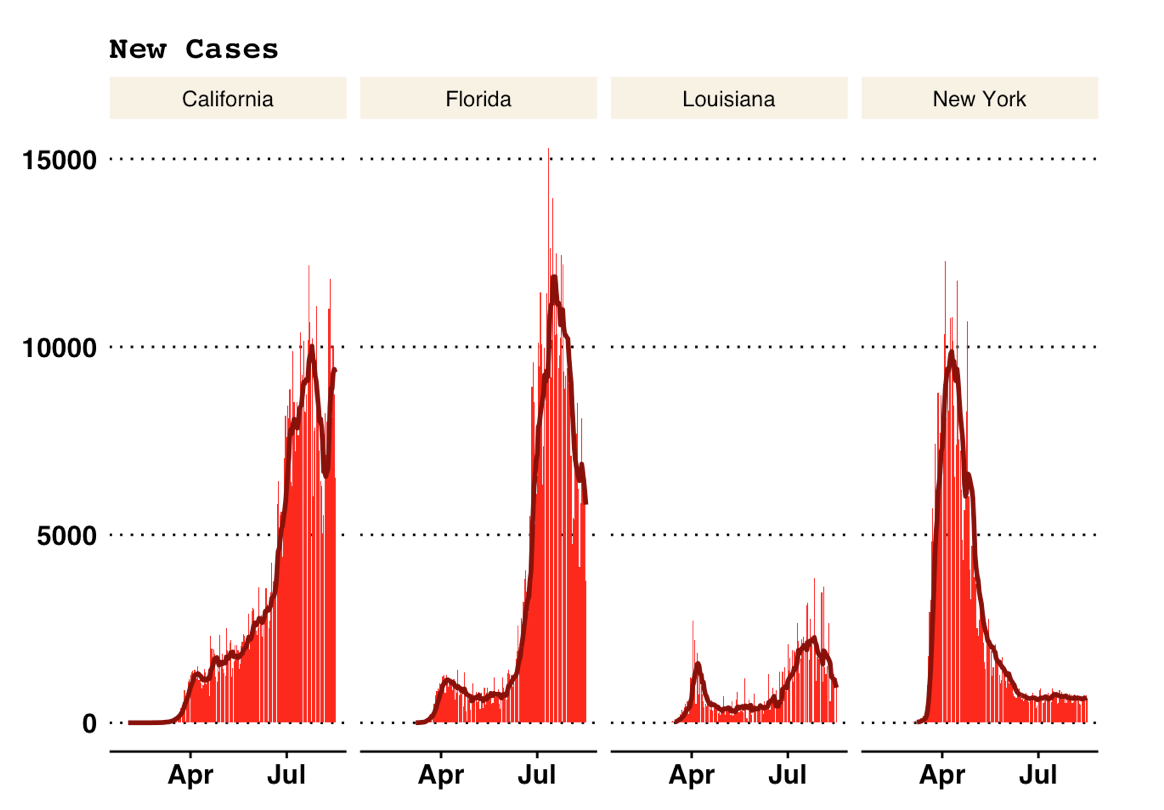
Analysis of COVID-19 Data
In this project I:
- Learned how to use dplyr to manipulate nationwide data for the COVID-19 pandemic
- Learned how to join two data sets
- Created tables with knitr and plots in ggplot
- Learned how to use lags and the rolling mean to calculate new cases and the 7 day average
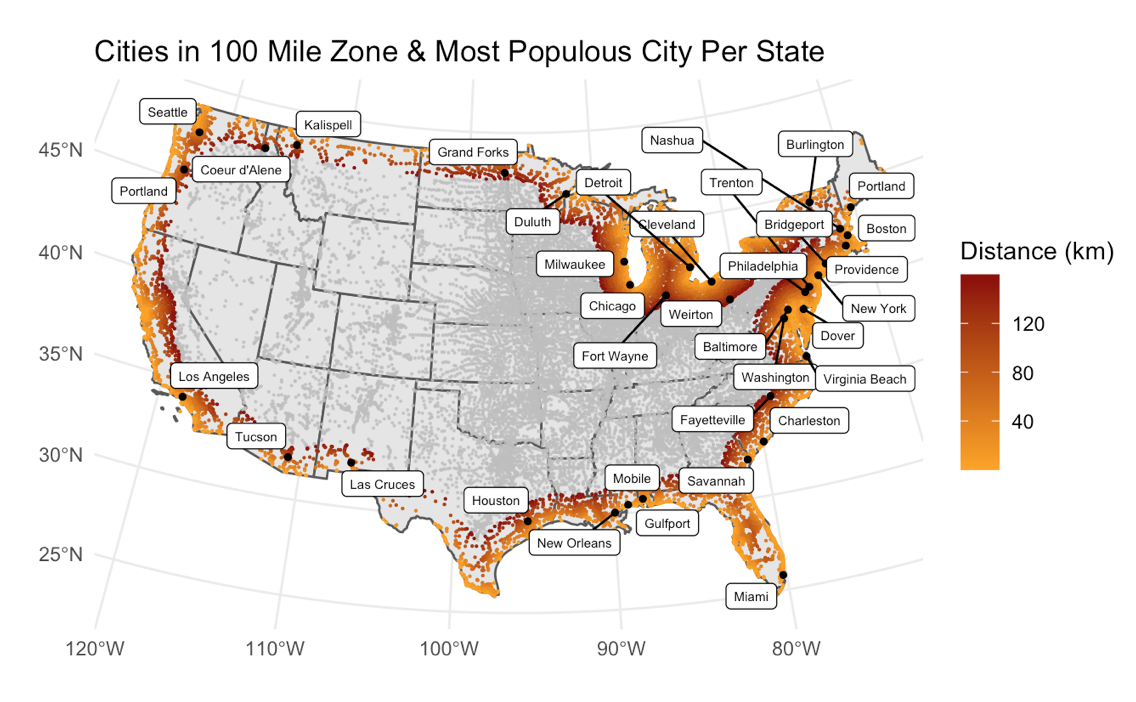
Distances and Projections
In this project I:
- Learned about map projections and coordinate systems
- Built simple feature objects from R packages and CSVs to use as spatial data
- Calculated the distances of US cities to various US borders
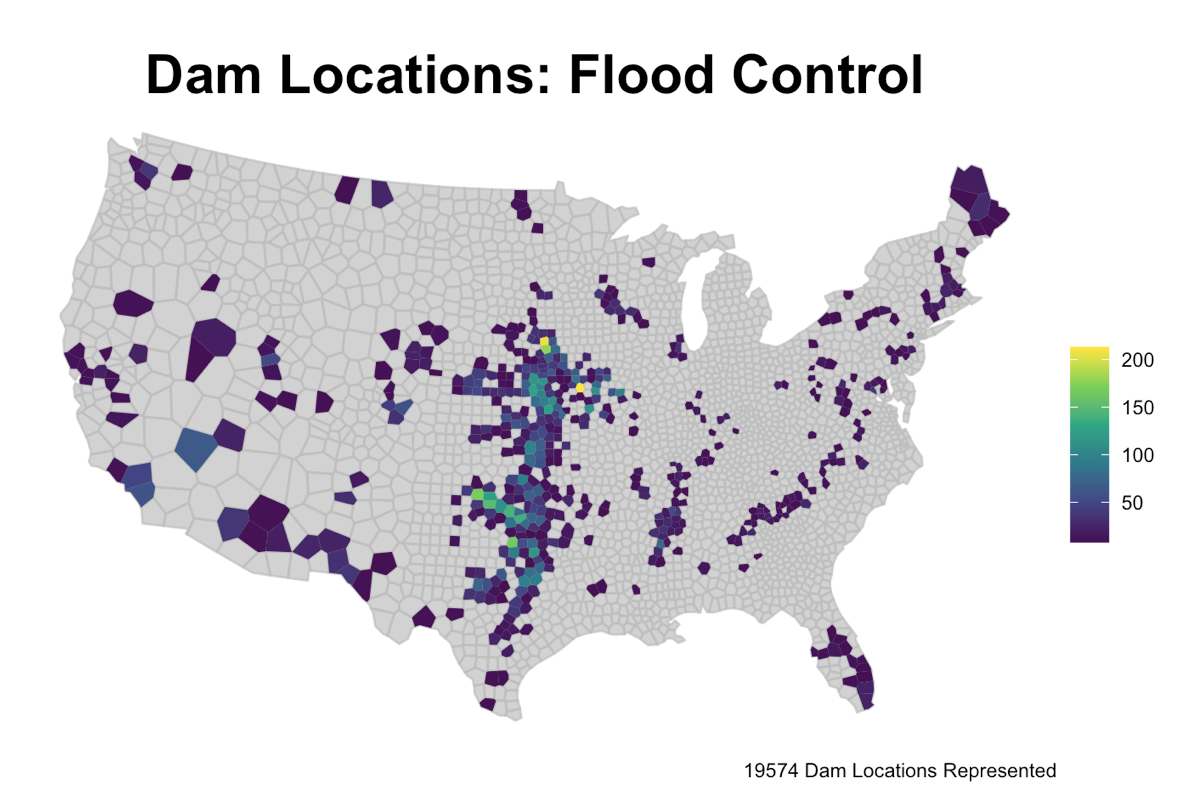
Tesselations, Point-in-Polygon
In this project I:
- Used tessellations to analyze dam data across the United States
- Learned the importance of geometric simplification for calculations of large data sets
- Wrote functions to simplify the coding process
- Used point-in-polygon counts on tessellation plots of the United States for visualization of dam distribution
- Made a leaflet map representing the largest, at risk flood control dams in each state
Raster Analysis
In this project I:
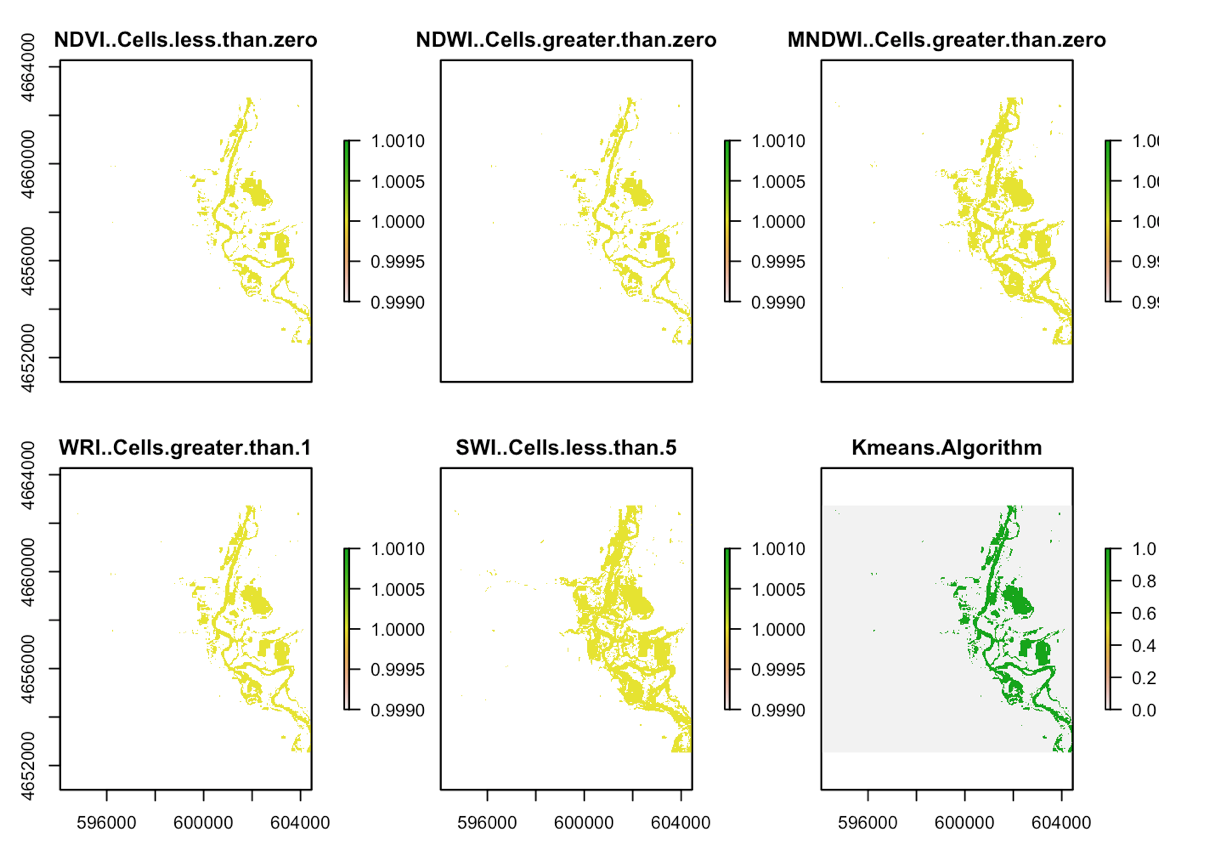
- Used Landsat 8 raster data to analyze flooding in a defined area of interest
- Manipulated RGB channels for Landsat imagery
- Learned how to use various threshold techniques to find surface water
- Calculated the kmeans to determine the accuracy of the binary raster layers
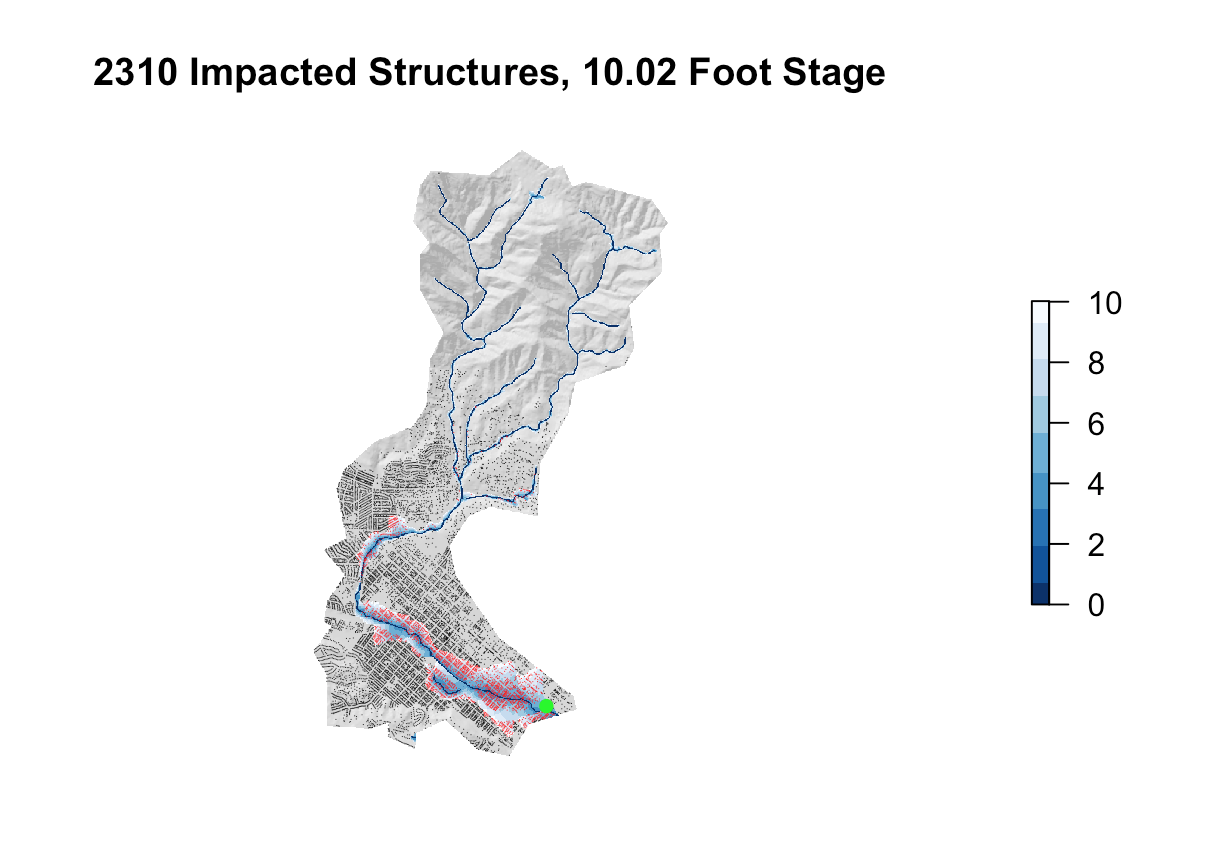
Flood Risk in Mission Creek: Past, Present, Future
In this project I:
- Used USGS water data to analyze the impact of flooding on buildings near Mission Creek
- Created a hillshade raster for visualization and a HAND raster to assess flood water levels
- Created a static and animated plot of the flooded area and impacted buildings
